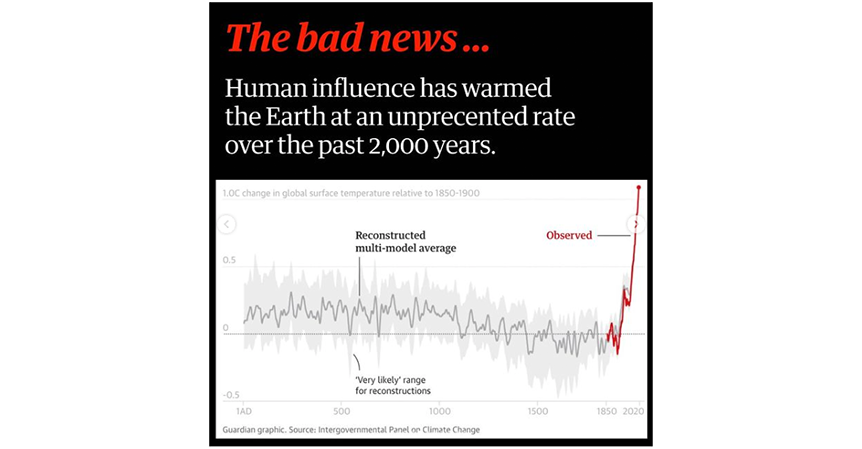
Visual formats, from scientific data visualizations to infographics, play a key role in conveying climate data. However, there's limited research on how people interpret these visuals, especially in news media. To explore this, we interviewed 17 experts in climate change, data visualization, and science communication, along with 12 laypeople. The interviews focused on aspects of climate change communication, data visualizations, and participants’ main takeaways from two example visualizations. Some key findings include:
-
Attention: Effective climate change communication in news and social media must reduce complexity to capture attention. Dramatic designs attract viewers but can appear manipulative, reducing trustworthiness, particularly for laypersons.
-
Individual Sensemaking: Understanding data visualizations is highly individual and influenced by prior knowledge, attitudes, and experiences. Experts formulated higher-level takeaway messages for the shown example visualizations, while lay participants focused on concrete details like color and titles.
-
Understandability: Simplifying visualizations for the public is crucial, as experts often overestimate public visual literacy. Textual explanations can bridge gaps between simplicity and accuracy.
-
From Visualization to Action: Engaging users to act on climate change information requires relatable, practical content. Visualizations showing the impact of actions and providing positive, solution-oriented messages can motivate readers to act.
In our paper, we reflect on how these insights can inform the design decisions behind creating impactful data visualizations, especially in news media targeting lay audiences. We explore finding the right balance between keeping things simple and ensuring accuracy. We also discuss techniques to make visualizations not just informative but also captivating.
R. Schuster, K. Gregory, T. Möller and L. Koesten, “”Being Simple on Complex Issues” – Accounts on Visual Data Communication About Climate Change,” in IEEE Transactions on Visualization and Computer Graphics, vol. 30, no. 9, pp. 6598-6611, Sept. 2024, doi: 10.1109/TVCG.2024.3352282. http://ieeexplore.ieee.org/document/10414428
We thank all interview participants for their time and valuable insights!

